Support users can view a Support Dashboard in Portal that lists every site in the Portal instance, and shows the number of Agents with failures, errors, missed backups and deferred backups in each site.
From the list of sites, Support users can select a specific site for viewing computers, jobs, process logs, and reports.
To view sites on the Support Dashboard:
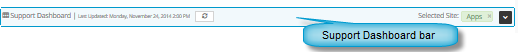
1. When signed in as a Support user, if a list of sites does not appear, click the Support Dashboard bar at the top of any page.
A list of sites appears. If a site is selected, the site name appears in the Selected Site box, and the site is highlighted in the Dashboard.
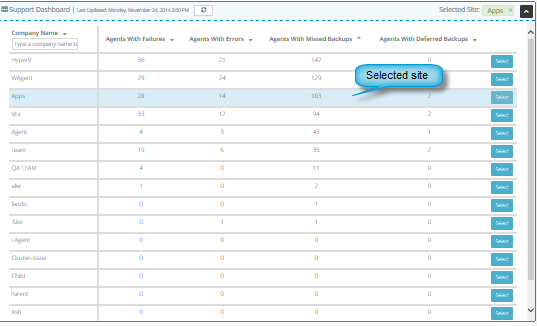
2. To change the order of sites, click the name of a column for determining the site order. To reverse the site order, click the column name again.
3. To filter the sites that appear, in the Company Name box, enter text that site names must match.
4. To refresh data,
click the Refresh dashboard button. 
5. To select a site for viewing detailed information, click the Select button in the site row.
Information for the selected site appears on the page. To view more information for the site, navigate to another page in Portal.