To see vault space usage and activities that could affect space usage on the vault (e.g., backup job changes and computer changes), Admin users and Support users can view and configure the Usage Summary Report chart.
Note: Data cannot be exported or emailed from the Usage Summary chart.
Vault space usage information is also available in the Usage Summary Report. See Usage Summary Report.
To view the Usage Summary Report chart:
1. When signed in as an Admin user or Support user, click Reports on the navigation bar.
The Reports page lists default and customized report views.
If you are signed in as a Support user, and the Support Dashboard appears on the Reports page, you need to select a site. See View reports as a Support user.
2. In the Usage Summary Report section, click Interactive Chart.
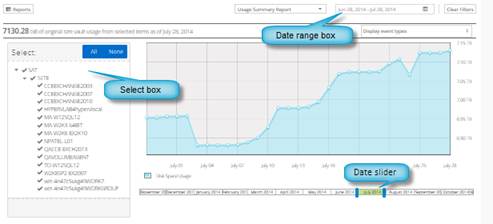
The Usage Summary Report chart shows vault disk usage in the past 30 days for all computers and environments in the site. The vertical axis scale and units change according to the amount of data.
Note: The vertical axis does not start at zero (0).
In the Select box, a check mark appears beside each vault, site, and computer or environment that is included in the chart.
3. To change which vaults, sites, and computers are included in the chart, do one or more of the following in the Select box, and then click Apply Filter:
•To exclude a vault, site, or computer from the chart, click the item name to clear the check mark.
•To remove all vaults, sites, and computers from the chart, click None. The check mark is cleared from every item name.
•To add a vault, site, or computer to the chart, click the item name so that a check mark appears.
•To add all vaults, sites, and computers to the chart, click All. A check mark appears beside every item name.
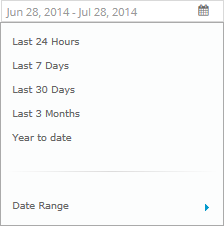
4. To change the chart date range, click the date range box. In the list that appears, do one of the following:
•Click a predefined date range:
•Last 24 Hours
•Last 7 Days
•Last 30 Days
•Last 3 Months
•Year to date
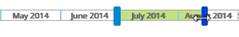
•In the date slider below the chart, drag the date range start and end markers to change the selected date range.
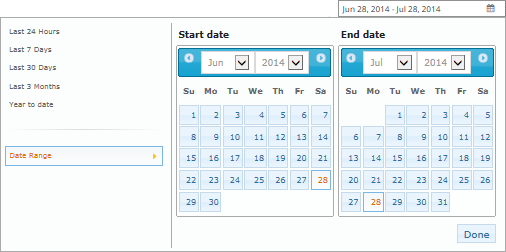
•Click Date Range, and specify a custom date range. In the Start date calendar, click the first day of records to include in the report. In the End date calendar, click the last day of records to include in the report. Click Done.
5. To view additional information on the chart, click the Display event types box. In the list, do one or more of the following:
•To view job changes, mark the Job Changes check box.
•To view computer changes, mark the Computer Changes check box.
•To view other configuration changes, mark the Other Config Changes check box.
•To view job changes, computer changes, and other configuration changes, mark the Show all check box.
To only view vault space usage on the chart, mark the Show none check box.
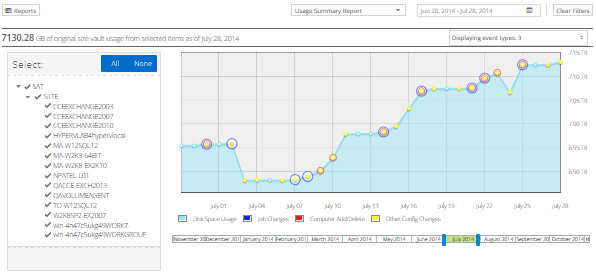
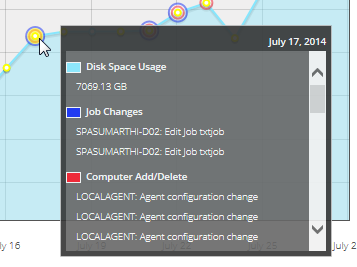
6. To view precise information about vault disk space usage and any displayed event types on a particular date, click the dot for the date on the chart.
A box shows the amount of disk space used on the vault, and detailed information about any displayed event types.