Admin users and Support users can view reports in Portal that provide information about backups, vault space usage, and activities in a site. For information about available reports, see Portal report descriptions.
Each report has a default view, which shows data for all protected computers and environments in a site. An Admin user or Support user can change the report date range, specify which data columns and records to show, and save the resulting report as a customized view. Admin users and Support users can view default report views and any customized report views that have been saved in their sites.
Note: You cannot view the Daily Status Report in Portal; you can only schedule it to run. See Schedule the Daily Status Report.
To view a report:
1. When signed in as an Admin user or Support user, click Reports on the navigation bar.
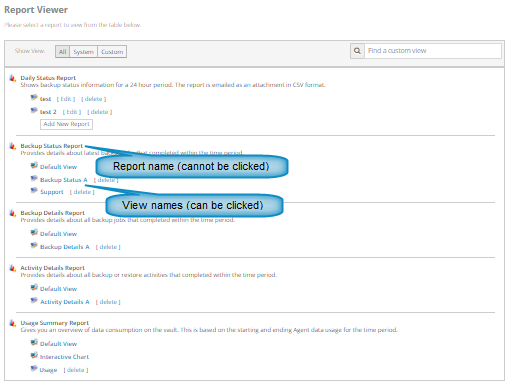
The Reports page lists available reports. Default and customized views of each report appear under the report name.
If you are signed in as a Support user, and the Support Dashboard appears on the Reports page, select a site. See View reports as a Support user.
Note: If an error message appears on the Reports page, short names might not be entered for the site. Short names are used to extract report data, and must be added by a Super user. See Add a short name for a site.
2. To reduce the number of views that are listed, do one of the following:
•To list default report views only, click System.
•To list customized report views only, click Custom.
•To list default reports and reports with specific characters in their names, enter the characters in the Find a custom view box.
3. Click a report view.
Note: You cannot click a report name (which appears in bold text). You can only click a report view.
Report data appears on the Reports page. If a scroll bar appears at the right side of the page, you can scroll down to see more records in the report.
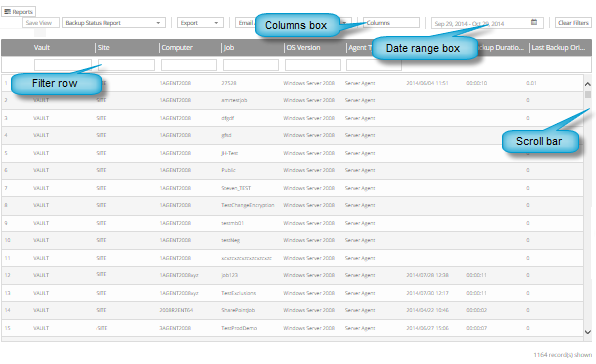
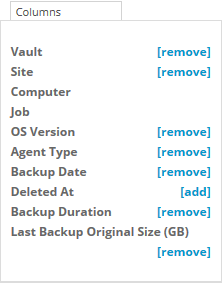
4. To change the columns that appear, click the Columns box. In the list that appears, do one or more of the following:
•To hide a column that currently appears, click [remove] beside the column name.
•To display a column that does not appear, click [add] beside the column name.
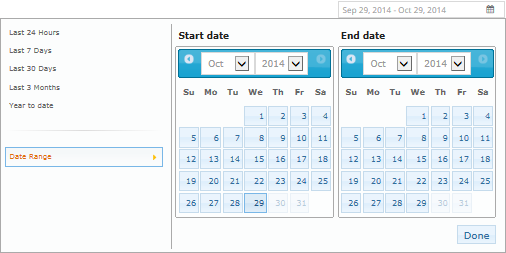
5. To change the report date range, click the date range box. In the list that appears, do one of the following:
•Click a pre-defined date range: Last 24 Hours, Last 7 Days, Last 30 Days, Last 3 Months, or Year to date.
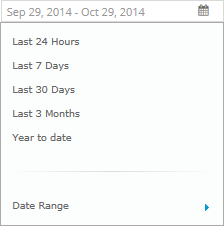
•Click Date Range, and specify a custom date range. In the Start date calendar, click the first day of records to include in the report. In the End date calendar, click the last day of records to include in the report. Click Done.
6. To change which data records appear, enter criteria that records must match. In the filter row under the column headings, in each column where you want to apply a filter, do one of the following:
•In the empty box, type text that records must match.
•In the list, click the value that records must match.
Records only appear in the report if they match all specified criteria.
7. When the report includes the data that you want to view, you can do any of the following:
•Save the customized report view. See Save a report view.
•Export the report data in comma-separated (.csv), Microsoft Excel (.xls), or Adobe Acrobat (.pdf) format. See Export a report.
•Email the report data to one or more recipients. Data can be emailed in comma-separated values (.csv), Microsoft Excel (.xls), or Adobe Acrobat (.pdf). See Email a report.
•Schedule the customized report to be emailed to one or more recipients. Data can be emailed in comma-separated (.csv), Microsoft Excel (.xls), or Adobe Acrobat (.pdf). See Schedule an emailed report.